
Learn / Price findings
DDR5 prices rose and stayed higher
Comparing the same US offers from September to November 2026, DDR5 prices rose a median 6.7%. See the capacity breakdown and storage comparison.
US retail offer prices · September 6–November 7, 2026
DDR5 price increases became more widespread through October and lasted into early November. Among 112 offers followed across the same cities in all nine observed weeks, the median increase was 6.7%. Sixty-eight remained more than 1% above their September 6–12 baseline in each of the final three weeks.
A median can remain at zero while many individual offers move. Figure 1 shows how widely increases spread; the weekly median table retains all three median series.

Storage prices moved less uniformly. The median change was zero across 85 NVMe SSD offers and 1.7% across 61 internal hard-drive offers. Rises and falls coexisted in both groups.
The DDR5 finding survives several changes to the observation rules: median increases range from 6.3% to 7.0% across the main, stricter, broader and endpoint-only comparisons. The wider checks support the direction of the finding, while leaving offers with insufficient observations unresolved.
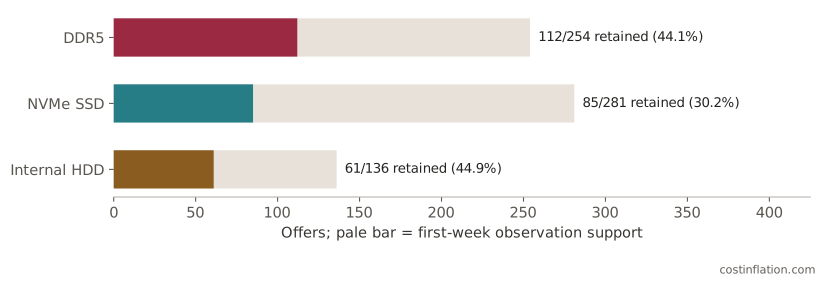
Scope matters: the main DDR5 group retains 112 of 254 offers with adequate first-week observations, or 44.1%. These are displayed offers, weighted equally. The results describe the studied offers; sales, seller continuity and item condition are not established.
More DDR5 offers joined the rise through October
The median stayed flat in September as increases accumulated in part of the group.
A zero median in September did not mean every price was unchanged. By September 27–October 3, 48 of the 112 DDR5 offers were more than 1% above baseline, but increases had not reached half the group. The median first moved clearly higher in October 4–10, when 59 offers exceeded that threshold.
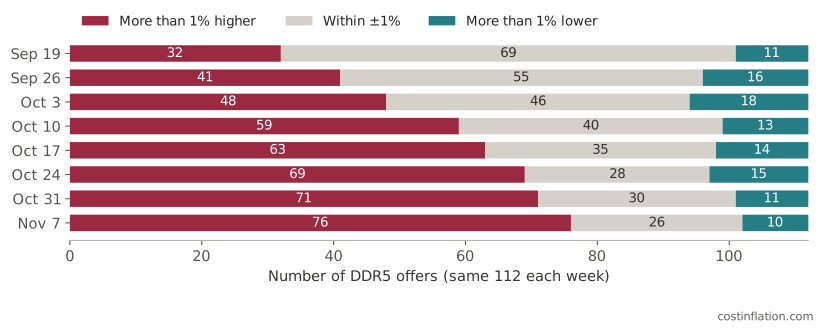
By November 1–7, 76 offers were more than 1% higher, 10 were more than 1% lower and 26 were within ±1% of baseline. That is a widening rise within the retained group, rather than a median lifted by a few unusually large increases.
| Week ending | DDR5 median | NVMe median | HDD median | DDR5 >+1% | DDR5 <-1% |
|---|---|---|---|---|---|
| 09/12 | +0.0% | +0.0% | +0.0% | 0/112 | 0/112 |
| 09/19 | +0.0% | +0.0% | +0.0% | 32/112 | 11/112 |
| 09/26 | +0.0% | +0.0% | +0.0% | 41/112 | 16/112 |
| 10/03 | +0.0% | +0.0% | +0.0% | 48/112 | 18/112 |
| 10/10 | +1.7% | +0.0% | +0.9% | 59/112 | 13/112 |
| 10/17 | +3.3% | +0.0% | +1.0% | 63/112 | 14/112 |
| 10/24 | +5.2% | +0.0% | +1.2% | 69/112 | 15/112 |
| 10/31 | +5.6% | +0.0% | +1.5% | 71/112 | 11/112 |
| 11/07 | +6.7% | +0.0% | +1.7% | 76/112 | 10/112 |
Medians use the same 112 DDR5, 85 NVMe SSD and 61 internal HDD offers each week. All changes use September 6–12 as the baseline; they are cumulative, not consecutive weekly inflation rates. The last two columns count DDR5 offers beyond the stated thresholds.
The higher prices persisted; the pace varied
A lasting elevation is a different finding from an accelerating rate of increase.
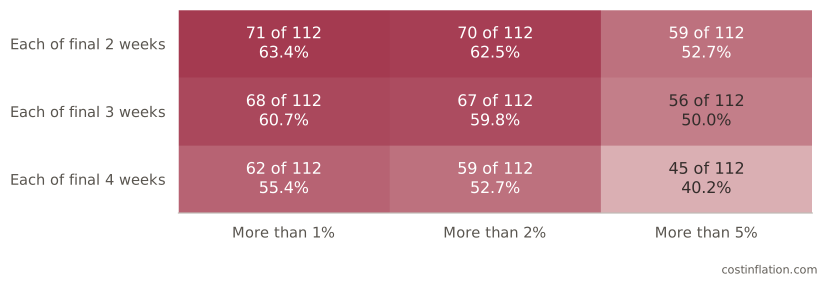
Persistence was tested against the original baseline in every one of the final weeks. Sixty-eight offers were more than 1% higher in each week from October 18 through November 7. Fifty-six—exactly half the group—were more than 5% higher in each of those three weeks.
The pace of increase was uneven. Recalculating each offer’s change over four weeks, then taking the median, gives five overlapping comparisons ranging from 0.8% to 2.1%; the last was 1.0%. Higher prices were sustained, but these observations do not show a steadily accelerating rate of increase.
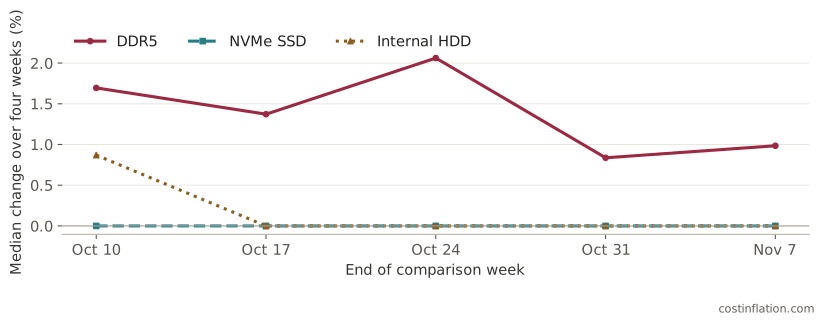
These four-week medians are calculated from each offer’s own return, not from changes between the cumulative medians in the weekly median table. Different minority groups can move in different weeks, leaving a weekly median at zero.
Storage prices were more divided
The SSD midpoint stayed flat while individual offers rose and fell.
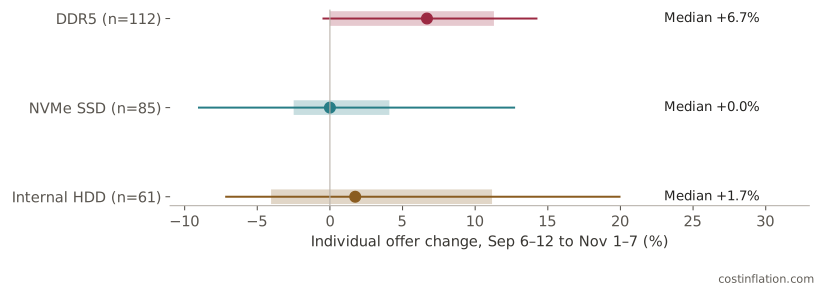
DDR5 had the clearest upward shift in the studied groups. Its middle half of individual changes ran from 0.0% to +11.3%. For NVMe SSDs, the middle half ranged from −2.5% to +4.1%. Twenty-eight SSD offers rose more than 1%, 24 fell more than 1%, and 33 stayed within ±1%.
| Category | Offers | Median | Geometric mean | Up / down / within ±1% |
|---|---|---|---|---|
| DDR5 | 112 | +6.7% | +6.4% | 76 / 10 / 26 |
| NVMe SSD | 85 | +0.0% | +1.2% | 28 / 24 / 33 |
| Internal HDD | 61 | +1.7% | +3.3% | 32 / 20 / 9 |
Internal hard drives had a positive median of 1.7%, but a much wider spread: the middle half extended from −4.1% to +11.2%. Thirty-two offers rose beyond 1% and 20 fell beyond 1%. This supports a narrower statement about a modest positive midpoint, alongside substantial variation.
The geometric mean combines every offer’s proportional change. It was +1.2% for NVMe despite the zero median, and +3.3% for HDD versus its +1.7% median. Those differences help show why one summary number cannot describe the whole distribution.
DDR5, NVMe SSDs and HDDs are different technologies with different offer mixes. This is a descriptive comparison under the same observation rules, not a comparison of equivalent performance or a controlled estimate of what caused their prices to differ.
The DDR5 increase extends across capacity groups
Both 16GB and 32GB offers rose; the lower-priced half of 32GB offers rose more widely.
Capacity was checked against the title-stated module or kit total before grouping offers. The 16GB group had a median increase of 8.5%; the 32GB group increased 5.5%. The median of each offer’s paired dollar change was +$20 and +$30, respectively.
| Total stated capacity | Offers | Median change | Median paired $ change | Higher >1% |
|---|---|---|---|---|
| 16GB | 28 | +8.5% | +$20 | 23/28 |
| 32GB | 43 | +5.5% | +$30 | 26/43 |
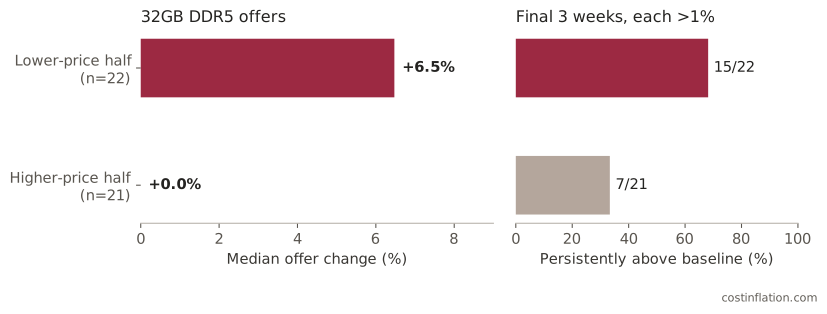
Within 32GB, offers at or below the group’s initial median price had a median increase of 6.5%, compared with zero above that cutoff. Fifteen of 22 in the lower-price half stayed above baseline by more than 1% throughout the final three weeks, versus seven of 21 in the higher-price half.
The direction also holds in the explicitly stated form factors: UDIMM offers had a +7.2% median change (75 offers), and SO-DIMM offers +7.4% (22 offers). These overlapping descriptions are not controlled comparisons of form factors; capacity, speed and other features still vary.
Other capacities remain in the overall DDR5 result. The 64GB group has 19 main offers, below the prespecified 20-offer floor for a separate estimate. Capacity is the total stated module/kit GB, not a performance tier. Paired dollar changes describe these offers, not current procurement quotes.
The positive DDR5 result survives a wider sample
The retention loss is material, so the analysis changes the coverage requirement as well as the summary statistic.
The main rule requires four observed days per city every week and at least six of the same cities throughout. Tightening this to five days and eight cities leaves 93 DDR5 offers, with a median increase of 6.8%. Relaxing it to two days and four cities admits additional reviewed offers: 144 in total, with a 7.0% median increase.
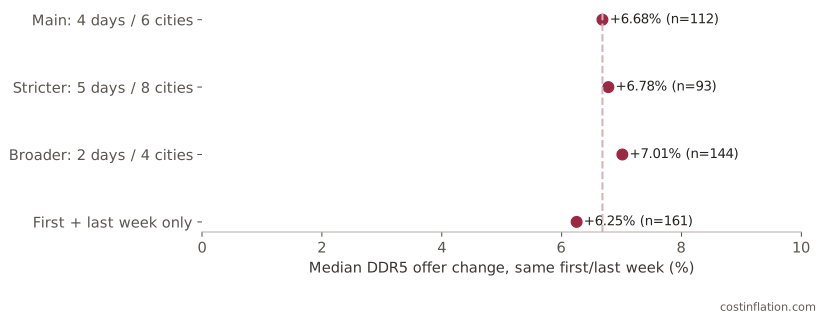
Requiring adequate observations only in the first and last week produces 161 reviewed offers and a +6.3% median change. That reduces dependence on continuous observation through every intermediate week. It still says nothing about prices missing from either endpoint.
The checks support a positive result among the offers that can be compared. They do not recover missing prices or turn the collection into a representative US market sample. The 6.3–7.0% spread is a sensitivity range, not a confidence interval.
Where the findings belong in a market briefing
They add downstream offer evidence to an industry discussion measured at several different levels.
Manufacturer pricing, component contracts and retail offers answer different questions. A useful memory briefing keeps those levels separate, even when they point in the same direction.
| Primary publication | What it measures or describes | How it relates to this report |
|---|---|---|
| Micron, September 30 [1] | Fiscal Q4, ended September 3: reported sequential DRAM price increases in the high teens and NAND increases of about 30%. | Manufacturer selling-price commentary; the fiscal period precedes this retail study. |
| Samsung, October 29 [2] | Q3 results: an AI-focused memory product mix amid capacity constraints. | Management’s qualitative account of its business, not a retail module-price measure. |
| TrendForce, September 30 [3] | Q4 forecast: conventional DRAM contracts +10–15% quarter on quarter; NAND Flash contracts +15–20%. | A dated forecast for a different transaction level. Calendar Q4 was incomplete at this report’s cutoff. |
Later TrendForce public synopses describe narrower client SSD contract gains (October 29), flat NAND wafer contracts (October 30), and weakening NAND spot prices (November 5) [4]. These are separate channels and products; their differences reinforce the need to identify the price being measured.
CostInflation’s contribution is the observed retail-offer contrast: DDR5 increased across much of the retained group, while NVMe SSD changes were more divided. This can test whether a broad “all memory is rising” description fits the particular retail offers being discussed. It cannot establish how much of an upstream increase reached consumers or explain the HDD result.
For a technology research desk
Use the weekly path, persistence counts and capacity breakdown in a downstream price section. Keep “observed offers” and the exact comparison weeks in the claim. The tables and charts in this report let an editor check denominators and compare results.
For an editor preparing a component-price story
The defensible angle is that DDR5 increases widened and lasted into November, with a contrast in SSD offers. The 32GB price-half comparison adds a specific distributional finding: the rise was not confined to offers that began above the group’s median price.
For an organization planning purchases
Use the finding to decide where a fresh, specification-matched quote check is most urgent. Budget commitments still require current model, condition, seller, availability and checkout terms. A category median from these offers cannot price a particular machine or order.
Preparing a client report? Commission a price study for your category.
References [1]–[4] are linked in the references below. Industry context is kept separate from CostInflation’s retail measurements.
How the prices were compared
The same offer and the same qualifying cities are followed through time.
1. Fix the period and the price basis
The primary study contains nine Sunday–Saturday weeks, September 6–November 7, 2026. It compares the first week with the final week, and tracks the weeks between them. The window was held fixed for all new analytical checks; it was not chosen to maximize their results. The analysis uses a fixed November 8 data snapshot.
The observations are US displayed offer prices in US dollars. An offer is a continuing listing identity, not a deduplicated manufacturer model, a sale or an independent seller. Title checks support category, stated capacity and consistency of the description. They do not verify every physical attribute, item condition, merchant continuity or checkout price.
2. Form a daily price, then a city-week price
For each offer, city and recorded date, select the latest observation before checking that its price and quantity are positive. A city qualifies for a week when at least four valid days remain. Its weekly price is the exact median of those daily prices.
3. Keep a fixed set of cities for each offer
Use the intersection of qualifying cities across all nine weeks, requiring at least six. The offer’s weekly price is the exact median of its city-week prices in that fixed set. Sets range from six to 12 cities and can differ by offer. Repeated observations in cities do not create extra independent offers.
4. Hold quantity constant and review meaning
Require one unchanged positive literal quantity and unit across the offer’s latest observations in the study window, including observations whose prices fail qualification. For memory, verify total module/kit capacity from the descriptions. For storage, verify drive category and capacity. Hold unresolved title, protocol or performance-description ambiguities out of the main group.
5. Give each retained offer one vote
Compute each offer’s percentage change as 100 × (final weekly price ÷ initial weekly price − 1). Report the median of those changes. The geometric mean is 100 × [exp(mean(log(final ÷ initial))) − 1]. Neither measure uses sales weights. Capacity-level dollar changes are medians of paired offer-price differences, not differences between the two cross-sectional median prices.
Fixed quantities make native total-price and per-unit percentage changes identical within each offer. The dollar exhibits use native displayed offer prices; no hypothetical kit price is constructed from a category unit-price average.
The checks behind the conclusions
Product checks and alternative comparison rules show how the result depends on the analysis.
| Check | Result and interpretation |
|---|---|
| Product descriptions | 331 offers and 427 title texts reviewed across the main and expanded candidates. Eight ambiguities held out; 323 retained for their eligible comparisons. This is not a count of unique manufacturer models. |
| Main groups | 258 offers: 112 DDR5, 85 NVMe SSD and 61 internal HDD. Each meets the full nine-week rule. |
| Title holds | Two main DDR5 and two expanded DDR5 wording/compatibility uncertainties; three NVMe protocol/performance uncertainties; one internal-HDD interface uncertainty. These are conservative holds, not confirmed product changes. |
| Reinclude main holds | Medians: DDR5 +6.7% (114 offers), NVMe 0.0% (88), HDD +1.5% (62). The main direction is preserved. |
| Same-part sensitivity | Four confirmed same-part/configuration pairs cover eight DDR5 offers. Merging each pair’s price relatives into one equal-weight unit leaves 108 units and a +6.6% median change. Other repeated models may remain unidentified. |
| Independent calculation | A second implementation recomputed main counts, distributions, weekly paths, persistence, capacity changes and observation-rule checks from the frozen private inputs. Expanded and same-part results were checked separately. |
| Dollar figures | Endpoint recorded amounts and USD currency were checked for all 71 offers in the 16GB and 32GB groups. All 142 endpoint offer medians and both paired-dollar summaries were reproduced. |
| Daily selection order | Selecting the latest observation before qualifying it produced zero cases in which an older valid same-day observation would otherwise have been substituted. |
| Small cells | Separate capacity and form-factor estimates require at least 20 reviewed offers. The 64GB cell (19) and both 16GB price halves (14 each) are not given separate estimates. |
First-week observation support covered 254 DDR5 offers, 281 NVMe offers and 136 HDD offers. One NVMe offer already had inconsistent observed quantity during that first week, leaving 280 with a stable first-week quantity. The full-window rule and semantic review then reduce the groups to the main counts above. The first-week support counts remain the retention denominators.
The main finding was already visible in the earlier exploratory sample. New persistence, capacity, selection and same-part checks were specified before their outcomes were computed. Semantic reviewers did not use offer-level price returns to decide inclusion. Reviewers knew the earlier aggregate result; this was not a fully blind study.
No random sampling model is claimed. Percentile bands describe the studied offers, and sensitivity checks describe choices in the analysis. Neither supplies a market-wide margin of error. Stable descriptions also leave unobserved seller, condition and selected-variant changes unresolved.
Definitions, citation and references
How to read the measures and cite the study.
Offer and n: an offer is a continuing listing identity. The count n gives equally weighted offers, except in the same-part check, where it gives grouped units. Neither count establishes independent manufacturer models or sellers.
Median: the middle of the ordered individual changes, averaging the two central values for an even count. Geometric mean: the equal-weight combination of offers’ proportional price changes, expressed as a percentage change.
Direction: up is more than +1%; down is below −1%; within includes both boundaries. Persistence: above the specified baseline threshold in every week of the ending window.
GB: title-supported total module/kit capacity, counting all modules in a kit. Percentiles: linear interpolation between sorted individual changes. These describe observed dispersion, not confidence intervals.
Citation
CostInflation Team. “DDR5 prices rose and stayed higher.” Published November 8, 2026. Observations: September 6–November 7, 2026. costinflation.com/blog/ddr5-price-study-november-2026.
Primary industry references
[1] Micron Technology, fiscal Q4 2026 earnings-call prepared remarks, September 30, 2026, printed page 7. Fiscal-quarter end confirmed in the official results release.
[2] Samsung Electronics, third-quarter 2026 results, October 29, 2026, memory-business discussion.
[3] TrendForce, Q4 2026 memory contract-price forecast, September 30, 2026, public release. Forecast status and product/transaction scope are preserved; no subscription tables are reproduced.
[4] TrendForce public report synopses: PC-client OEM SSD contracts, October 29; NAND wafer contracts, October 30; NAND spot-price discussion, November 5, 2026. Public summaries were read; subscription tables were not accessed.
Research and analysis: CostInflation Team · Published November 8, 2026. Displayed-price observations through November 7.
Follow the current series
The DDR5 RAM price history, NVMe SSD price history and internal hard-drive price history show the current category indices. Those series can include a changing product mix; this dated study follows the same selected offers.
For an earlier comparison of price levels, see the September memory and storage analysis.